
Lecture 07: Normalization and Data Modeling
DATA 351: Database Design
February 2, 2026
Overview 🚁
What We Will Cover
Today we learn to structure data so it does not structure us.
Why Normalization Matters 🤷
The Spreadsheet Problem
You have probably seen spreadsheets like this in the wild:
| OrderID | Customer | CustomerEmail | Product1 | Qty1 | Product2 | Qty2 | Product3 | Qty3 |
|---|---|---|---|---|---|---|---|---|
| 1001 | Acme Corp | orders@acme.com | Widget | 5 | Gadget | 2 | ||
| 1002 | Acme Corp | orders@acme.com | Sprocket | 10 | ||||
| 1003 | Beta Inc | purchasing@beta.io | Widget | 3 | Gadget | 1 | Sprocket | 7 |
This looks reasonable at first glance. Then someone orders four products.
Data Anomalies: The Horror Stories
When data is poorly structured, three types of anomalies haunt your database:
If Acme Corp changes their email address, you must update every single row where they appear. Miss one? Now you have conflicting data.
OrderID 1001: orders@acme.com
OrderID 1002: orders_new@acme.com  -- Oops!
You want to add a new customer who has not placed an order yet. Where do you put them? The table requires an OrderID, but they have no orders.
You either:
- Invent a fake order (bad)
- Leave OrderID NULL (breaks the key)
- Create a separate customer table (correct)
If you delete the only order from a customer, you lose all information about that customer. They vanish from your database like they never existed.
The Cost of Messy Data
Bad database design is expensive:
- Storage bloat from redundant data
- Slower queries from scanning duplicates
- Data inconsistency from update anomalies
- Developer headaches from complex application logic
- Lost data from delete anomalies
Normalization prevents all of these problems.
Normalization Overview 💡
What Is Normalization?
Normalization is the process of organizing data to:
- Minimize redundancy (do not repeat yourself)
- Eliminate anomalies (prevent bad things)
- Ensure data integrity (keep it consistent)
- Enable efficient querying (make it fast)
Think of it as Marie Kondo for databases. Does this column spark joy in this table? No? It belongs somewhere else.
The Normalization Process Overview
The high-level workflow looks like this:
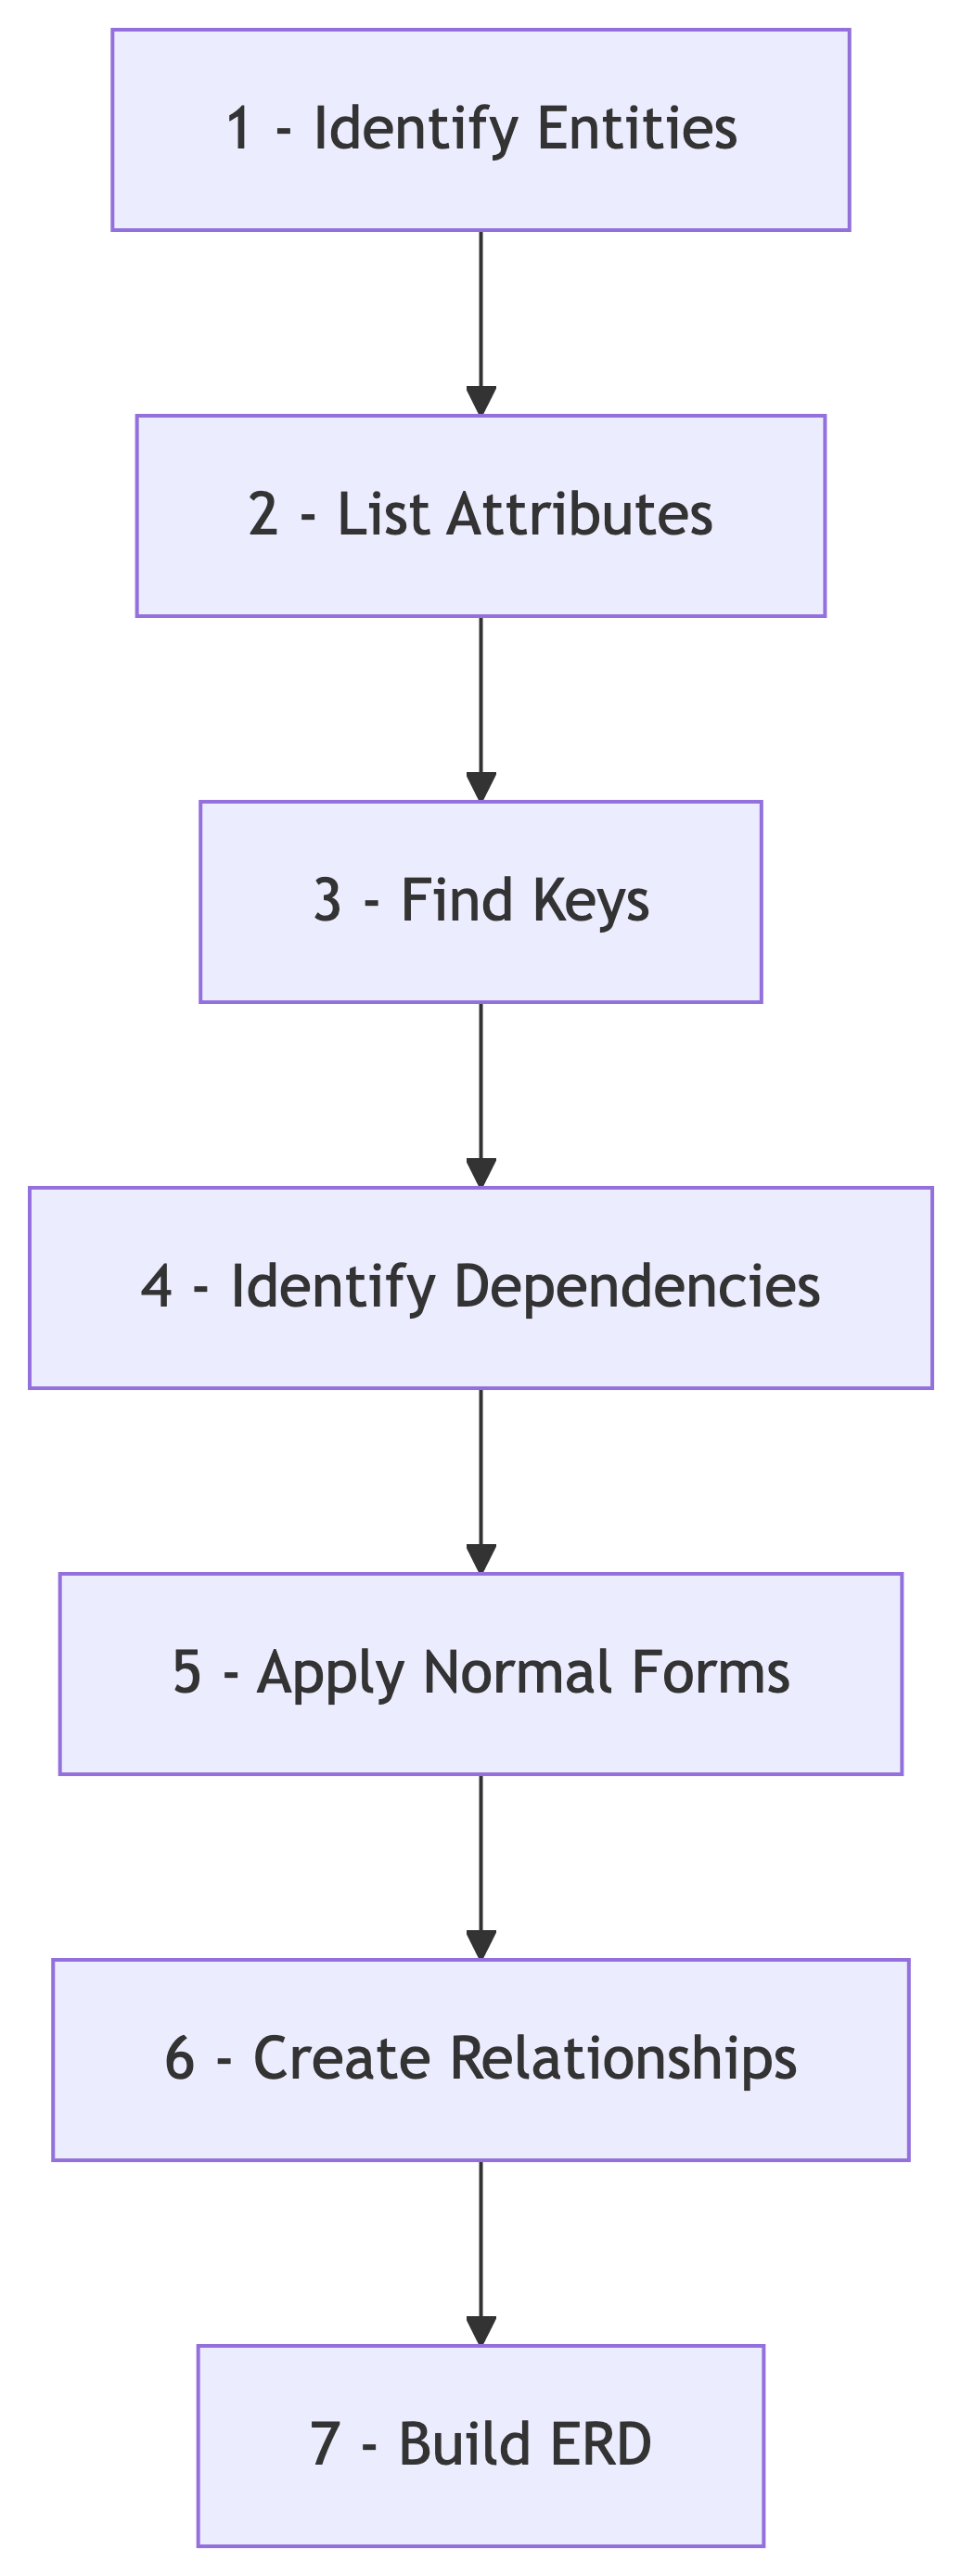
| Step | Question to Ask |
|---|---|
| 1. Identify Entities | What things exist in this domain? |
| 2. List Attributes | What describes each entity? |
| 3. Find Keys | What uniquely identifies each row? |
| 4. Identify Dependencies | What determines what? |
| 5. Apply Normal Forms | Should we split this table? |
| 6. Create Relationships | How do we connect tables with foreign keys? |
| 7. Build ERD | How do we document and communicate the design? |
Normal Forms in Detail 🔍
What Is a Key?
A key is one or more attributes that uniquely identify a row in a table.
Keys are foundational to relational databases:
- They enforce uniqueness (no duplicate rows)
- They enable relationships between tables
- They are essential for normalization analysis
Without keys, we cannot distinguish one row from another.
Types of Keys
The chosen key used to uniquely identify rows in a table. Every table should have exactly one primary key.
employee(employee_id, full_name, email)
         ___________
              PK
Any attribute or set of attributes that could serve as the primary key. A table may have multiple candidate keys.
In an employee table, both employee_id and email might be unique. Both are candidate keys, but we choose one as primary.
Any set of attributes that uniquely identifies rows, including extra (non-minimal) attributes.
{employee_id, full_name} is a super key, but not a candidate key because full_name is unnecessary for uniqueness.
An attribute in one table that references the primary key of another table. Creates relationships between tables.
employee.department_id -> department.department_idCandidate Keys vs Primary Keys
Candidate keys are all possible keys. Primary key is the one you pick.
| employee_id | full_name | |
|---|---|---|
| 1 | michael@dm.com | Michael Scott |
| 2 | dwight@dm.com | Dwight Schrute |
| 3 | jim@dm.com | Jim Halpert |
Candidate keys here: employee_id, email
Both uniquely identify rows. We typically choose employee_id as the primary key because:
- It is shorter and more efficient to index
- Email addresses can change
- Numeric IDs are easier to reference in foreign keys
Understanding Functional Dependencies
Before we dive into normal forms, we need to understand functional dependencies.
A functional dependency exists when one attribute determines another:
StudentID -> StudentName
This means: if you know the StudentID, you can determine exactly one StudentName.
Written as: StudentID functionally determines StudentName
Tip
Think of it like a function in programming: getStudentName(studentID) always returns the same name for the same ID.
Types of Dependencies
An attribute depends on the entire primary key, not just part of it.
In a table with key (OrderID, ProductID):
- Quantity depends on BOTH OrderID AND ProductID (full)
- CustomerName depends only on OrderID (partial)
An attribute depends on only part of a composite key.
This is a problem. It means data is in the wrong table.
A -> B -> C where A determines B, and B determines C, but B is not a key.
Example: StudentID -> DeptID -> DeptName
The student determines the department, and the department determines the department name. But DeptID is not a candidate key.
First Normal Form (1NF)
Rule: No repeating groups or arrays. Each cell contains exactly one atomic value.
| EmpID | Name | PhoneNumbers |
|---|---|---|
| 1 | Michael | 555-1234, 555-5678 |
| 2 | Dwight | 555-9999 |
Multiple values in one cell. SQL cannot query individual phone numbers easily.
| EmpID | Name | PhoneNumber |
|---|---|---|
| 1 | Michael | 555-1234 |
| 1 | Michael | 555-5678 |
| 2 | Dwight | 555-9999 |
One value per cell. Now we can search, filter, and index phone numbers.
1NF: Another Common Violation
Repeating columns are also a violation:
| StudentID | Course1 | Grade1 | Course2 | Grade2 | Course3 | Grade3 |
|---|---|---|---|---|---|---|
| S001 | Math | A | Physics | B | ||
| S002 | Math | B | Chemistry | A | Biology | A |
What if a student takes 10 courses? 50 courses?
| StudentID | Course | Grade |
|---|---|---|
| S001 | Math | A |
| S001 | Physics | B |
| S002 | Math | B |
| S002 | Chemistry | A |
| S002 | Biology | A |
Scalable. Clean. Queryable.
Second Normal Form (2NF)
Rule: Must be in 1NF, plus no partial dependencies on the primary key.
This only matters when you have a composite primary key.
Primary Key: (OrderID, ProductID)
| OrderID | ProductID | ProductName | Quantity | UnitPrice |
|---|---|---|---|---|
| 1001 | P01 | Widget | 5 | 9.99 |
| 1001 | P02 | Gadget | 2 | 14.99 |
| 1002 | P01 | Widget | 10 | 9.99 |
ProductName and UnitPrice depend only on ProductID, not the full key!
Orders Table:
| OrderID | ProductID | Quantity |
|---|---|---|
| 1001 | P01 | 5 |
| 1001 | P02 | 2 |
| 1002 | P01 | 10 |
Products Table:
| ProductID | ProductName | UnitPrice |
|---|---|---|
| P01 | Widget | 9.99 |
| P02 | Gadget | 14.99 |
Now each table has a single theme.
Third Normal Form (3NF)
Rule: Must be in 2NF, plus no transitive dependencies.
Non-key attributes should depend only on the key, not on other non-key attributes.
| EmpID | EmpName | DeptID | DeptName | DeptLocation |
|---|---|---|---|---|
| 1 | Michael | D01 | Management | Floor 3 |
| 2 | Dwight | D02 | Sales | Floor 2 |
| 3 | Jim | D02 | Sales | Floor 2 |
EmpID -> DeptID -> DeptName (transitive dependency)
Employees Table:
| EmpID | EmpName | DeptID |
|---|---|---|
| 1 | Michael | D01 |
| 2 | Dwight | D02 |
| 3 | Jim | D02 |
Departments Table:
| DeptID | DeptName | DeptLocation |
|---|---|---|
| D01 | Management | Floor 3 |
| D02 | Sales | Floor 2 |
Update the department once, and it is correct everywhere.
The 3NF Mantra
Bill Kent famously summarized 3NF as:
“Every non-key attribute must provide a fact about the key, the whole key, and nothing but the key, so help me Codd.”
- The key: Attribute depends on the primary key
- The whole key: Depends on ALL of the key (no partial dependencies)
- Nothing but the key: Does not depend on non-key attributes (no transitive dependencies)
Boyce-Codd Normal Form (BCNF)
Rule: A stricter version of 3NF. Every determinant must be a candidate key.
Most tables in 3NF are also in BCNF. The difference matters in edge cases with overlapping candidate keys.
Consider course scheduling where:
- Each student takes one course per semester
- Each course is taught by one professor
- Each professor teaches only one course
| Student | Course | Professor |
|---|---|---|
| Alice | Math101 | Dr. Smith |
| Bob | Math101 | Dr. Smith |
| Carol | Phys201 | Dr. Jones |
Candidate keys: (Student, Course) or (Student, Professor)
Professor -> Course is a dependency, but Professor is not a superkey.
Enrollment:
| Student | Professor |
|---|---|
| Alice | Dr. Smith |
| Bob | Dr. Smith |
| Carol | Dr. Jones |
Teaching:
| Professor | Course |
|---|---|
| Dr. Smith | Math101 |
| Dr. Jones | Phys201 |
Now every determinant is a candidate key.
When to Stop Normalizing
3NF is usually sufficient for most applications. BCNF is the practical maximum.
Higher normal forms exist (4NF, 5NF, 6NF) but are rarely needed in practice.
Warning: Over-normalization can hurt performance:
- Too many joins slow down queries
- Some denormalization is acceptable for read-heavy workloads
- Data warehouses often use denormalized star schemas
The goal is eliminating anomalies, not winning a normalization contest.
Normal Forms Summary
| Form | Rule | Fixes |
|---|---|---|
| 1NF | Atomic values only | Repeating groups |
| 2NF | No partial dependencies | Composite key issues |
| 3NF | No transitive dependencies | Non-key -> non-key |
| BCNF | Every determinant is a candidate key | Overlapping keys |
Relational Notation 📝
What Is Relational Notation?
Relational notation is a shorthand, textual way to represent a database table’s structure, including its name, attributes, primary keys, and foreign keys.
It acts as a stepping stone between:
- Identifying entities and attributes (conceptual design)
- Creating ERD diagrams (visual/logical design)
- Writing SQL CREATE statements (physical implementation)
Think of it as pseudocode for database design. ERDs are the visual, logical representation of the same information that relational notation captures in text form.
Relational Notation Syntax
The basic format is:
table_name(attribute_1, attribute_2, attribute_3, ...)Conventions:
- Primary Key: Underlined or marked with PK
- Foreign Key: Marked with FK, often with arrow to referenced table
- Composite Key: Multiple underlined attributes
- Naming: Use snake_case to align with PostgreSQL conventions
Example:
employee(employee_id, full_name, department_id, email)
         ___________              _____________
              PK                   FK -> department
Reading Relational Notation
Given this notation:
department(department_id, department_name, location)
           _____________

employee(employee_id, full_name, department_id, hire_date)
         ___________             _____________
                                  FK -> department
We understand:
- Two tables exist:
departmentandemployee - Each department has an ID (PK), name, and location
- Each employee has an ID (PK), name, department reference (FK), and hire date
- Employees link to departments via
department_id
Why Use Relational Notation?
Benefits:
- Quick to write and read
- Easy to iterate on design
- Technology agnostic
- Good for whiteboard discussions
- Natural precursor to ERD creation
You can sketch a database design in minutes without opening any tools.
Normalization Activity: Dunder Mifflin 🏬
Our Dataset: The Office
We have employee data from Dunder Mifflin Paper Company:
employee_id,full_name,department,email,hire_date,salary_usd,
is_manager,performance_rating,years_experience,commission_rate,last_login
1,Michael Scott,Management,michael.scott@dundermifflin.com,2005-03-24,
75000.00,true,3.2,15,,2026-01-15 09:12:00
2,Dwight Schrute,Sales,dwight.schrute@dundermifflin.com,2006-04-12,
62000.00,false,4.8,12,0.08,2026-01-16 08:01:00
...
Let us normalize this data step by step.
Step 1: Examine the Flat File
| employee_id | full_name | department | hire_date | salary_usd | is_manager | performance_rating | years_experience | commission_rate | last_login | |
|---|---|---|---|---|---|---|---|---|---|---|
| 1 | Michael Scott | Management | michael.scott@… | 2005-03-24 | 75000.00 | true | 3.2 | 15 | 2026-01-15 | |
| 2 | Dwight Schrute | Sales | dwight.schrute@… | 2006-04-12 | 62000.00 | false | 4.8 | 12 | 0.08 | 2026-01-16 |
| 3 | Pam Beesly | Reception | pam.beesly@… | 2007-07-02 | 42000.00 | false | 3.9 | 8 | ||
| 4 | Jim Halpert | Sales | jim.halpert@… | 2005-10-05 | 61000.00 | false | 4.1 | 10 | 0.07 | 2026-01-16 |
| 5 | Angela Martin | Accounting | angela.martin@… | 2006-08-15 | 52000.00 | false | 4.5 | 11 | 2026-01-15 |
Questions to ask:
- What are the entities here?
- What determines what?
- Is there redundancy?
Step 2: Check 1NF
Is this data in First Normal Form?
Checklist:
- Each cell has one value? Yes
- No repeating groups? Yes
- All rows unique? Yes (employee_id is unique)
This data is already in 1NF. Good start.
Step 3: Identify Dependencies
What does employee_id determine?
employee_id -> full_name
employee_id -> department
employee_id -> email
employee_id -> hire_date
employee_id -> salary_usd
employee_id -> is_manager
employee_id -> performance_rating
employee_id -> years_experience
employee_id -> commission_rate
employee_id -> last_login
Are there other dependencies?
department -> ??? (Does department determine anything else?)Think about it: does knowing the department tell us anything specific?
Step 4: Check 2NF
Is there a composite key? No, employee_id alone is the primary key.
With a single-column primary key, 2NF is automatically satisfied.
We are in 2NF.
Step 5: Check 3NF and Find Issues
Looking for transitive dependencies…
The department column contains the department name directly. What if departments have additional attributes?
Consider:
- Department -> Department Manager
- Department -> Cost Center
- Department -> Floor Location
If we wanted to add these, we would repeat them for every employee in that department.
Problem Identified: Department should be its own entity.
Step 6: Decompose to 3NF
Let us create a separate department table:
Relational Notation:
department(department_id, department_name)
           _____________

employee(employee_id, full_name, department_id, email, hire_date,
         ___________             _____________
         salary_usd, is_manager, performance_rating,
         years_experience, commission_rate, last_login)

         FK: department_id -> department(department_id)
Step 7: Consider Additional Decomposition
Should we split further?
Sales-specific attributes:
commission_rateonly applies to Sales employees- NULL for everyone else
Options:
- Keep it simple (NULLs are okay)
- Create a
sales_employeesubtype table
For this dataset, option 1 is reasonable. The NULL rate is low.
Step 8: Consider Login Tracking
The last_login column represents temporal data. What if we want login history?
Current: Single timestamp, overwrites each time
Better design for history:
login_history(login_id, employee_id, login_timestamp)
              ________  ___________
                            FK -> employee

employee(employee_id, ...)  -- Remove last_login
But for the current requirement (just last login), the original design works.
Final Normalized Design
department(department_id, department_name)
           _____________

employee(employee_id, full_name, department_id, email, hire_date,
         ___________             _____________
         salary_usd, is_manager, performance_rating,
         years_experience, commission_rate, last_login)

FK: employee.department_id -> department.department_id
From Design to Implementation
We have completed the logical design using relational notation:
department(department_id, department_name)
           _____________

employee(employee_id, full_name, department_id, email, hire_date,
         ___________             _____________
         salary_usd, is_manager, performance_rating,
         years_experience, commission_rate, last_login)

FK: employee.department_id -> department.department_id
Coming Soon: Physical Implementation
In an upcoming lecture, we will cover:
- DDL (Data Definition Language): CREATE TABLE, ALTER TABLE, DROP TABLE
- Table Constraints: PRIMARY KEY, FOREIGN KEY, UNIQUE, NOT NULL, CHECK
- Data Types: Choosing appropriate PostgreSQL types
- Importing Data: Loading CSV files into normalized tables
For now, focus on understanding how to design the logical structure.
Activity: Your Turn
Working in pairs, answer these questions:
- What other attributes might Department have in a real company?
- Should
is_managerbe a separate table or role-based system? - How would you model an employee having multiple departments?
- What index would you add and why?
Take 5 minutes, then we will discuss.
Entity-Relationship Diagrams 🧑🎨
What Is an ERD?
An Entity-Relationship Diagram (ERD) is a visual representation of your database structure.
ERDs show:
- Entities (tables)
- Attributes (columns)
- Relationships (foreign keys)
- Cardinality (one-to-one, one-to-many, many-to-many)
ERDs are the universal language of database design.
ERD Components
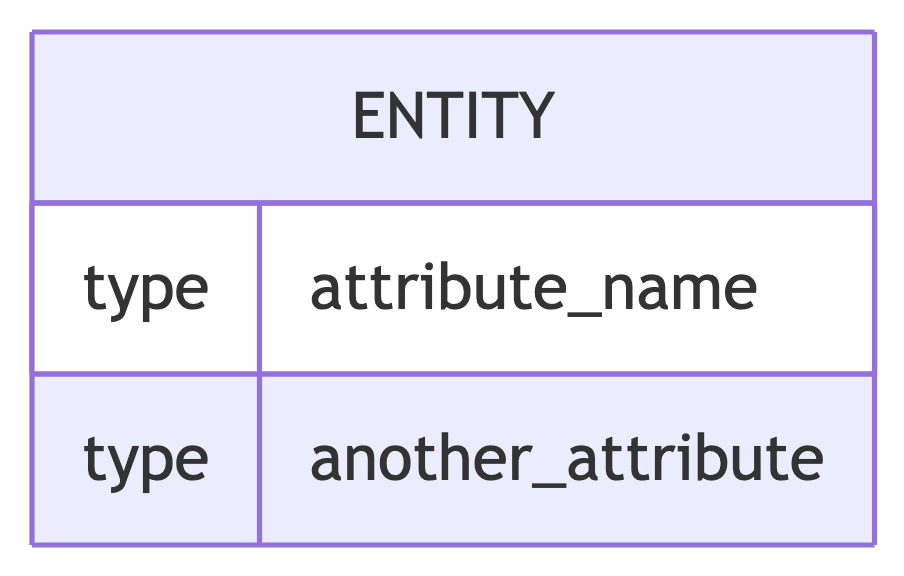
Rectangles represent tables. The entity name appears at the top.
Listed inside the entity box with their data types.
Lines connecting entities show how they relate. The line style indicates cardinality.
||One (mandatory)|oZero or one (optional)}|Many (at least one)}oZero or many
Crow’s Foot Notation
The most common ERD notation style:

Crow’s Foot Notation Symbols
| Symbol | Meaning |
|---|---|
| Line with perpendicular line | One (mandatory) |
| Line with circle | Zero (optional) |
| Line with crow’s foot | Many |
Reading ERD Relationships
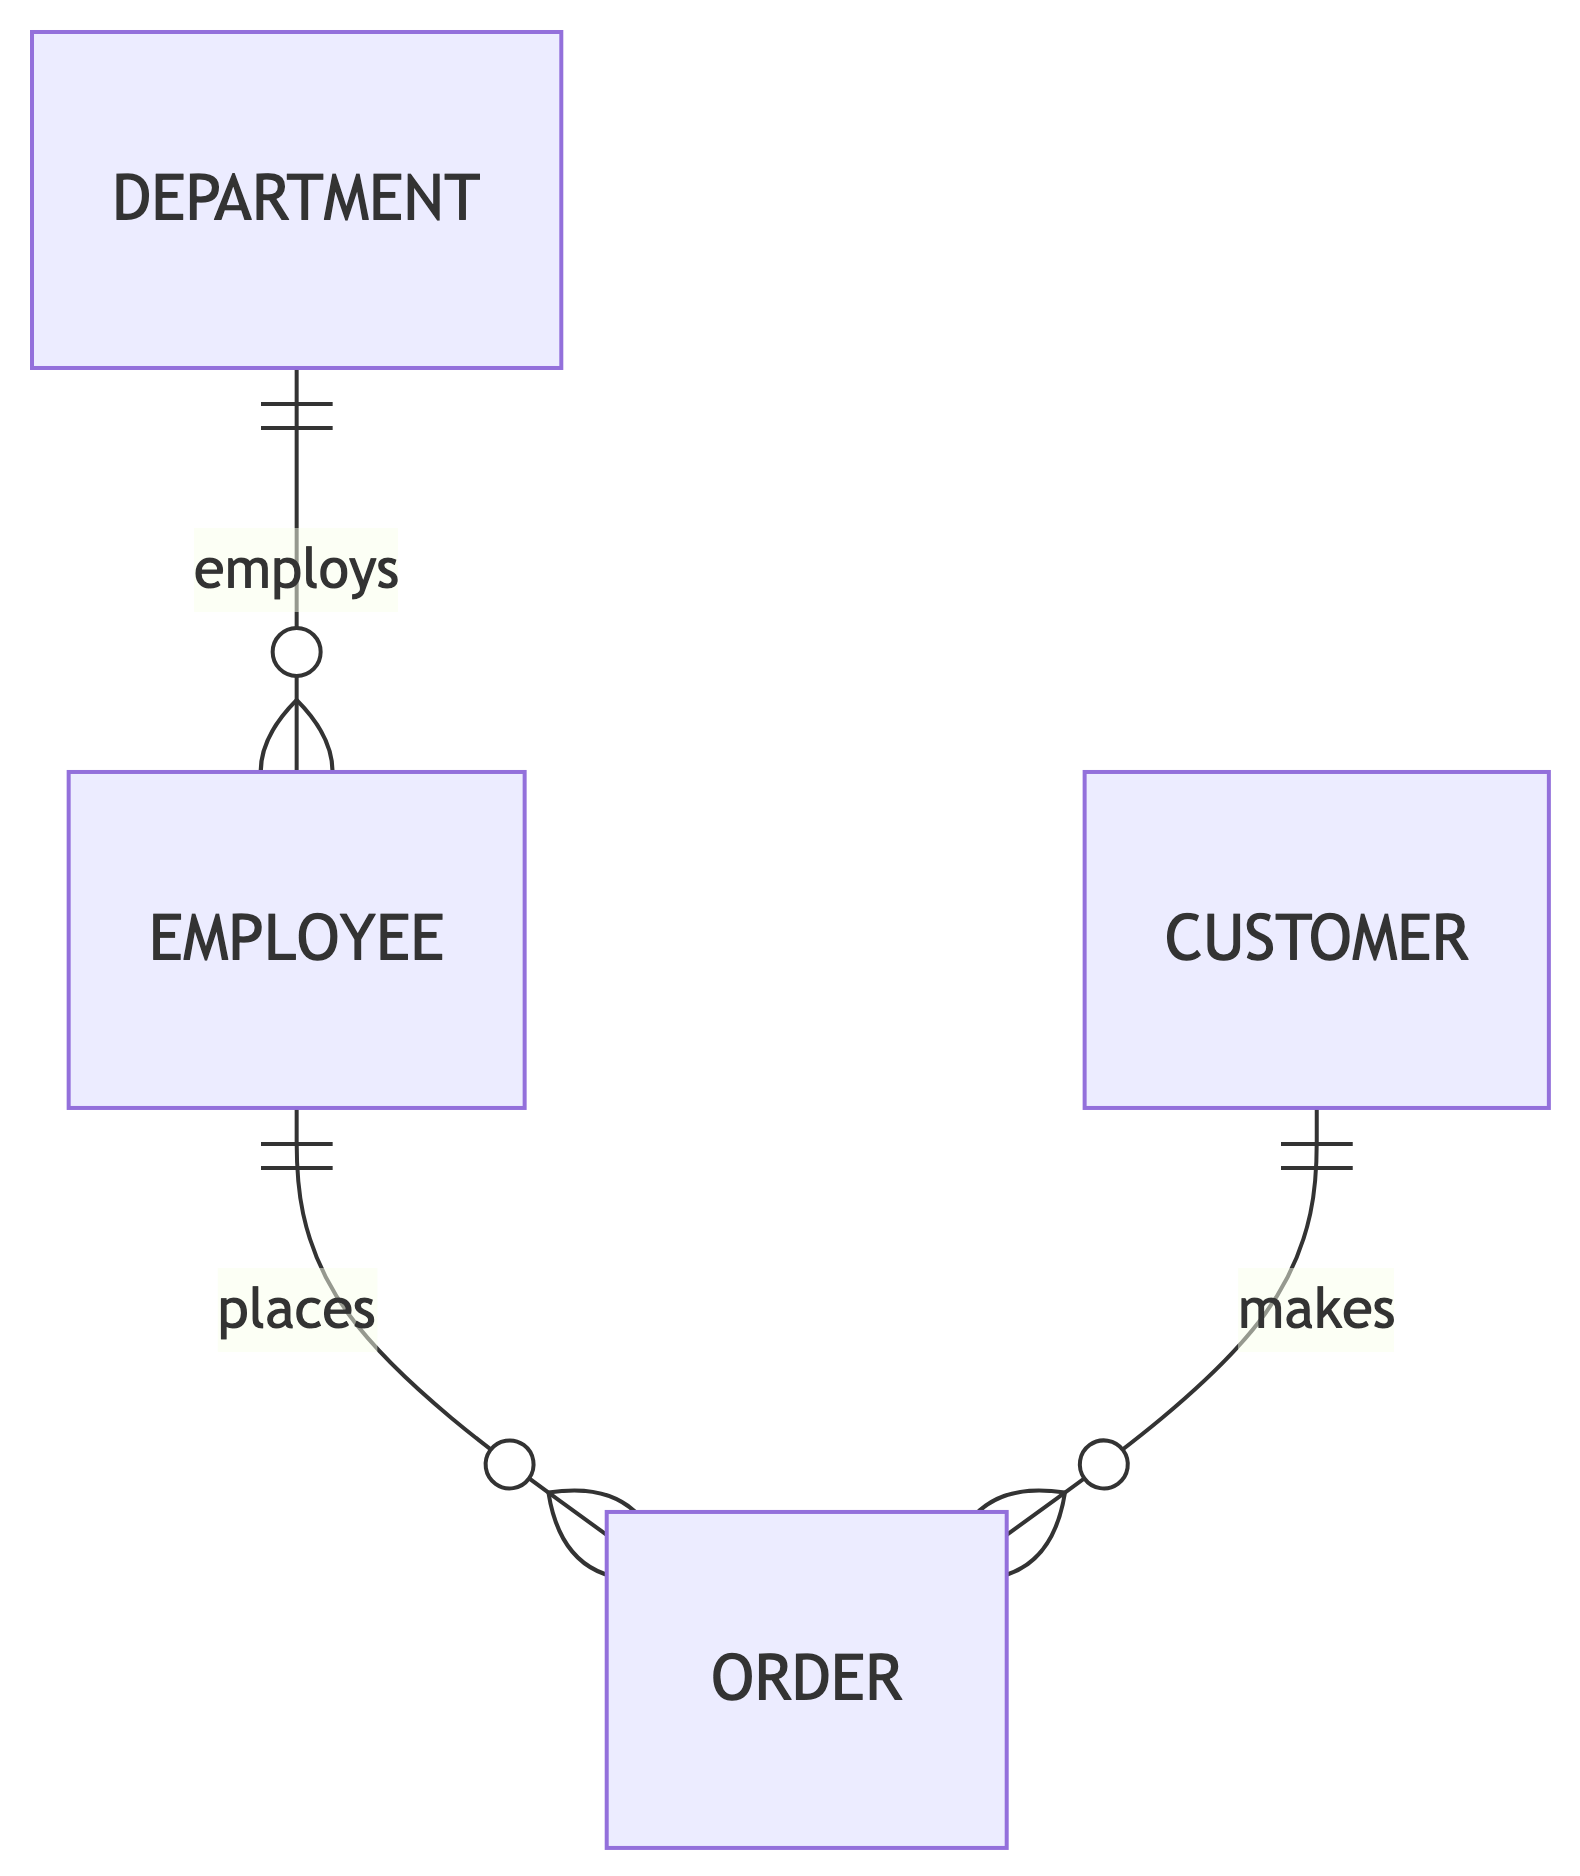
Reading this diagram:
- One DEPARTMENT employs zero or many EMPLOYEEs
- One EMPLOYEE places zero or many ORDERs
- One CUSTOMER makes zero or many ORDERs
Creating ERDs with draw.io
draw.io (also known as diagrams.net) is a free, browser-based diagramming tool.
Why draw.io?
- Free and open source
- Works in browser (no installation)
- Has built-in ERD shapes
- Exports to PNG, PDF, SVG
- Integrates with Google Drive, GitHub
Access it at: https://app.diagrams.net
draw.io: Getting Started
- Go to app.diagrams.net
- Choose where to save (local, Google Drive, etc.)
- Click “Create New Diagram”
- Select “Entity Relationship” template
- Find “Entity Relation” shapes in the left panel
- Drag an “Entity” shape to the canvas
- Double-click to rename
- Click the + to add attributes
- Hover over an entity until you see connection points
- Drag a line from one entity to another
- Right-click the line to change the line style
- Add relationship labels
- Adjust colors and fonts as needed
- File > Export as > PNG/PDF/SVG
- Include in your documentation
draw.io ERD Example
Creating our Dunder Mifflin schema:
- Create “Department” entity with:
- department_id (PK)
- department_name
- Create “Employee” entity with:
- employee_id (PK)
- full_name
- department_id (FK)
- hire_date
- salary_usd
- … other attributes
- Connect Employee to Department with one-to-many line
Alternative Tools
While we focus on draw.io, other options exist:
| Tool | Pros | Cons |
|---|---|---|
| draw.io | Free, easy, browser-based | Manual relationship lines |
| Lucidchart | Polish, collaboration | Paid for full features |
| dbdiagram.io | Code-based syntax | Limited free tier |
| pgModeler | PostgreSQL specific | Steeper learning curve |
| MySQL Workbench | Reverse engineering | MySQL focused |
For this course, draw.io is sufficient and recommended.
ERD Best Practices
- Consistent naming: Use same conventions throughout
- Show cardinality: Always indicate relationship types
- Include keys: Mark PK and FK clearly
- Logical grouping: Place related entities near each other
- Avoid crossing lines: Rearrange to minimize line crossings
- Add descriptions: Include relationship verb phrases
- Keep it readable: Break into sub-diagrams if too complex
Activity: Create an ERD
Using draw.io, create an ERD for a simplified library system:
Entities:
- Book (isbn, title, publication_year)
- Author (author_id, name, birth_year)
- Member (member_id, name, email, join_date)
- Loan (loan_id, loan_date, return_date)
Relationships:
- A book can have multiple authors
- An author can write multiple books
- A member can have multiple loans
- Each loan is for one book
Take 10 minutes, then share your diagrams.
Applying Normalization: Oregon Turtle Conservation 🐢
A Real-World Normalization Challenge
Oregon’s native freshwater turtles need help. The Oregon Conservation and Recreation Fund (OCRF) and Oregon Department of Fish and Wildlife (ODFW) track turtle sightings through a citizen science platform.
The raw sighting data arrives as a denormalized CSV file with issues we need to fix:
- Repeated submitter information across rows
- Multiple observations per submission
- Redundant location data
- Mixed temporal data (submission time vs. observation time)
This is exactly the kind of messy data you will encounter in practice.
The Conservation Context
Two native species are in decline:
- Northwestern Pond Turtle (Actinemys marmorata)
- Western Painted Turtle (Chrysemys picta bellii)
Threatened by two invasive species:
- Red-eared Slider (Trachemys scripta elegans)
- Common Snapping Turtle (Chelydra serpentina)
Citizens report sightings via mobile app. ODFW biologists review and intervene when necessary.
The Current Data Structure
The CSV contains denormalized data where a single submission spans multiple rows:
| Submission ID | First Name | Latitude | Longitude | Observation ID | Species | Behavior | Count | |
|---|---|---|---|---|---|---|---|---|
| 101 | Jane | jane@… | 45.123 | -122.456 | 1001 | WesternPond | Basking | 3 |
| 101 | Jane | jane@… | 45.123 | -122.456 | 1002 | RedEaredSlider | Swimming | 1 |
| 102 | Bob | bob@… | 44.987 | -123.111 | 1003 | WesternPainted | Basking | 2 |
Notice how Jane’s submission information repeats because she observed two species.
Identifying Normalization Issues
What problems do you see?
Submitter information (name, email, phone) repeats for every observation within a submission. Location data also repeats.
If Jane submits a report with 5 species, her contact info appears 5 times.
If Jane changes her email, we must update every row where she appears. Miss one? Data inconsistency.
The flat file conflates three distinct concepts:
- Submitter (the person reporting)
- Submission (a single report event)
- Observation (each species sighted)
Repeated text values that should be normalized:
- Species names
- Behavior types
- Status values (New, Pending, Approved, Rejected)
- Action taken values
Your Assignment Preview
Your assignment will be to design a normalized schema for this turtle sighting data:
- Analyze the denormalized CSV file
- Identify all functional dependencies
- Create a complete Entity-Relationship Diagram normalized to 3NF
- Document your design decisions and assumptions
This is an ERD-only assignment. Focus on the logical design; we will implement the physical schema in a later assignment.
Putting It All Together 🧩
The Complete Workflow

This is the professional database design workflow. We cover the first four steps in this lecture and the final two in the upcoming DDL and data import lecture.
From Spreadsheet to Schema
Starting point: Messy spreadsheet from business users
- Understand the data: What entities exist? What are the relationships?
- Identify dependencies: What determines what?
- Apply normal forms: Decompose until 3NF/BCNF
- Document in relational notation: Quick text representation
- Create ERD: Visual/logical documentation
- Write SQL DDL: CREATE TABLE statements (upcoming lecture)
- Migrate data: Load and transform from source (upcoming lecture)
- Validate: Test queries, check constraints
Common Pitfalls to Avoid
- Normalizing too early (understand data first)
- Over-normalizing (not everything needs 5 tables)
- Ignoring performance (sometimes denormalization is okay)
- Forgetting NULL handling (design for missing data)
- Skipping documentation (future you will thank present you)
- Not considering growth (will this scale?)
Key Takeaways
- Normalization prevents anomalies - Update, insert, delete problems go away
- 3NF is usually sufficient - Do not over-engineer
- Relational notation is fast - Sketch designs quickly
- ERDs communicate designs - Universal visual language
- Practice makes perfect - The more you normalize, the better you get
Looking Ahead
Next steps:
- Complete the Oregon Turtle Conservation ERD assignment (Assignment 4)
Questions?
References 📚
References
Codd, E. F. (1970). A Relational Model of Data for Large Shared Data Banks. Communications of the ACM, 13(6), 377-387.
Kent, W. (1983). A Simple Guide to Five Normal Forms in Relational Database Theory. Communications of the ACM, 26(2), 120-125.
Silberschatz, A., Korth, H., & Sudarshan, S. (2019). Database System Concepts (7th ed.). McGraw-Hill.
Date, C. J. (2003). An Introduction to Database Systems (8th ed.). Addison-Wesley.
Oregon Department of Fish and Wildlife. (n.d.). Oregon Turtle Conservation. https://www.dfw.state.or.us/wildlife/turtle/
diagrams.net. (n.d.). Free Online Diagram Software. https://www.diagrams.net