
Lecture 03-2: Storytelling with Data
DATA 503: Fundamentals of Data Engineering
January 26, 2026
Storytelling with Data
Data engineering is not just about moving bytes. It is about enabling decisions.
Your pipeline exists to answer a question that matters.
Why Storytelling Matters
The Pipeline Serves the Story
Every data engineering project answers a question:
- What is happening?
- Why is it happening?
- What should we do about it?
Your pipeline is the infrastructure that makes the answer credible.
Three Parts of a Data Story
Without a question, you have a data dump.
Without evidence, you have an opinion.
Without an action, you have a report nobody reads.
Why Pipelines Enable Better Stories
Raw data from a single source tells a limited story.
Combining multiple sources creates new knowledge:
| Single Source | Combined Sources |
|---|---|
| Weather data shows rainfall | Weather + traffic + accidents reveals crash risk patterns |
| Job postings list skills | Job postings + salary data + geography shows where to move |
| Restaurant inspections show violations | Inspections + reviews + demographics reveals food desert risks |
The Data Engineering Advantage
You are not just analysts. You are infrastructure builders.
Your project will:
- Ingest data from multiple disparate sources
- Transform and normalize into a unified schema
- Enable queries that were previously impossible
This is how you create new knowledge.
Example Project Deep Dive
Oregon Trail Towns: Tourism and Economic Resilience
Research Question:
Which small Oregon towns along historic tourism corridors show the strongest relationship between seasonal visitor traffic and local business survival rates?
Why This Question Matters
Small towns depend on tourism but lack data infrastructure.
A chamber of commerce director asks:
- Should we invest in a summer festival?
- Which business types survive tourist seasons?
- How do we compare to similar towns?
No single dataset answers this. But combining three does.
Data Source 1: StreetLight Data (Traffic Counts)
Source: StreetLight InSight API (academic access available)
What it provides:
- Estimated vehicle and pedestrian counts by location
- Origin-destination patterns
- Day-of-week and seasonal breakdowns
Ingestion approach:
- API calls with geographic bounding boxes
- Weekly batch pulls for historical data
- Store raw JSON, parse into normalized tables
Data Source 2: Oregon Secretary of State Business Registry
Source: Oregon Business Registry public data export
What it provides:
- Business registration and dissolution dates
- Business type classifications
- Registered agent addresses (gives location)
Ingestion approach:
- Monthly CSV download from state portal
- Incremental loads tracking new registrations and dissolutions
- Geocode addresses to link with traffic zones
Data Source 3: Census Bureau ACS 5-Year Estimates
Source: Census API (data.census.gov)
What it provides:
- Population by town
- Median household income
- Employment by industry sector
Ingestion approach:
- Annual API pull at census tract level
- Crosswalk tracts to town boundaries
- Store as slowly changing dimension
The Combined Schema
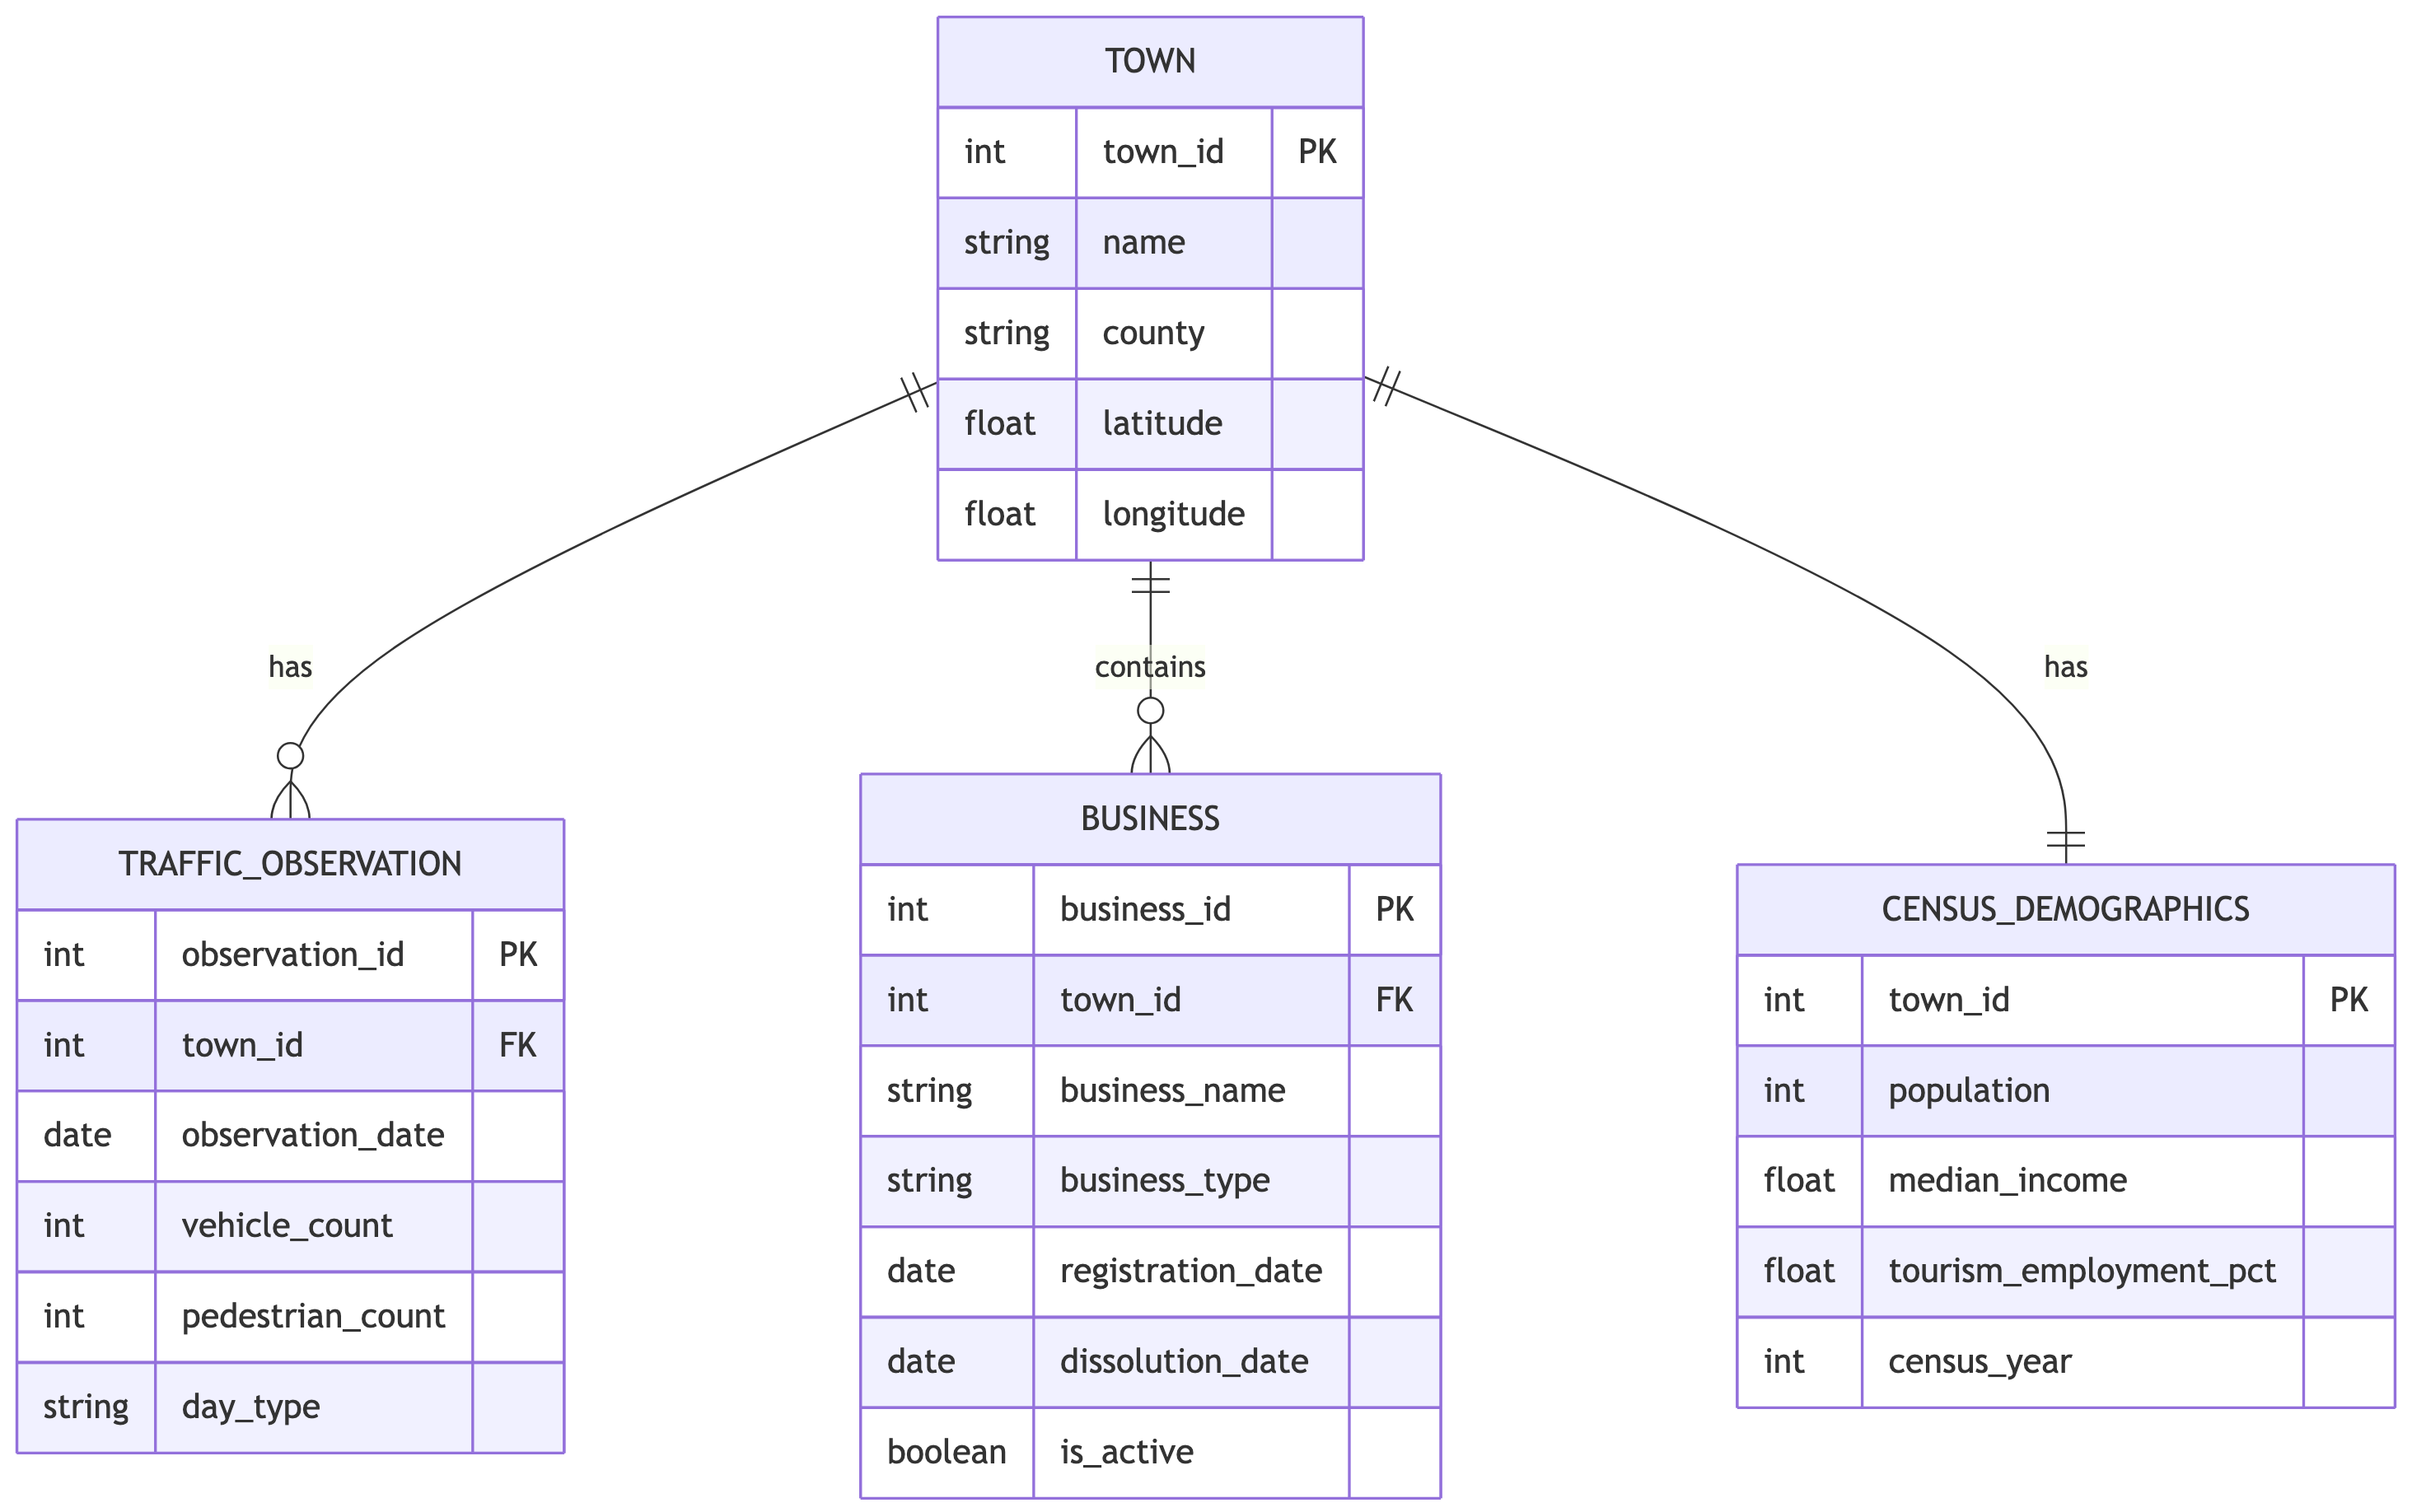
The Transformation Layer
Key derived metrics:
-- Seasonal traffic ratio
SELECT
    town_id,
    SUM(CASE WHEN MONTH(observation_date) IN (6,7,8)
        THEN vehicle_count ELSE 0 END) * 1.0 /
    NULLIF(SUM(CASE WHEN MONTH(observation_date) IN (1,2,12)
        THEN vehicle_count ELSE 0 END), 0)
    AS summer_winter_ratio
FROM traffic_observation
GROUP BY town_id;

-- Business survival rate by type
SELECT
    town_id,
    business_type,
    COUNT(CASE WHEN is_active THEN 1 END) * 1.0 /
    COUNT(*) AS survival_rate
FROM business
WHERE registration_date < DATE_SUB(CURRENT_DATE, INTERVAL 3 YEAR)
GROUP BY town_id, business_type;
The Story This Pipeline Tells
With this infrastructure, you can answer:
- Towns with high summer/winter traffic ratios and high restaurant survival rates are resilient tourism economies
- Towns with high ratios but low survival rates may have infrastructure gaps
- Comparing similar-population towns reveals what works
The action: Target economic development resources to towns with potential but gaps.
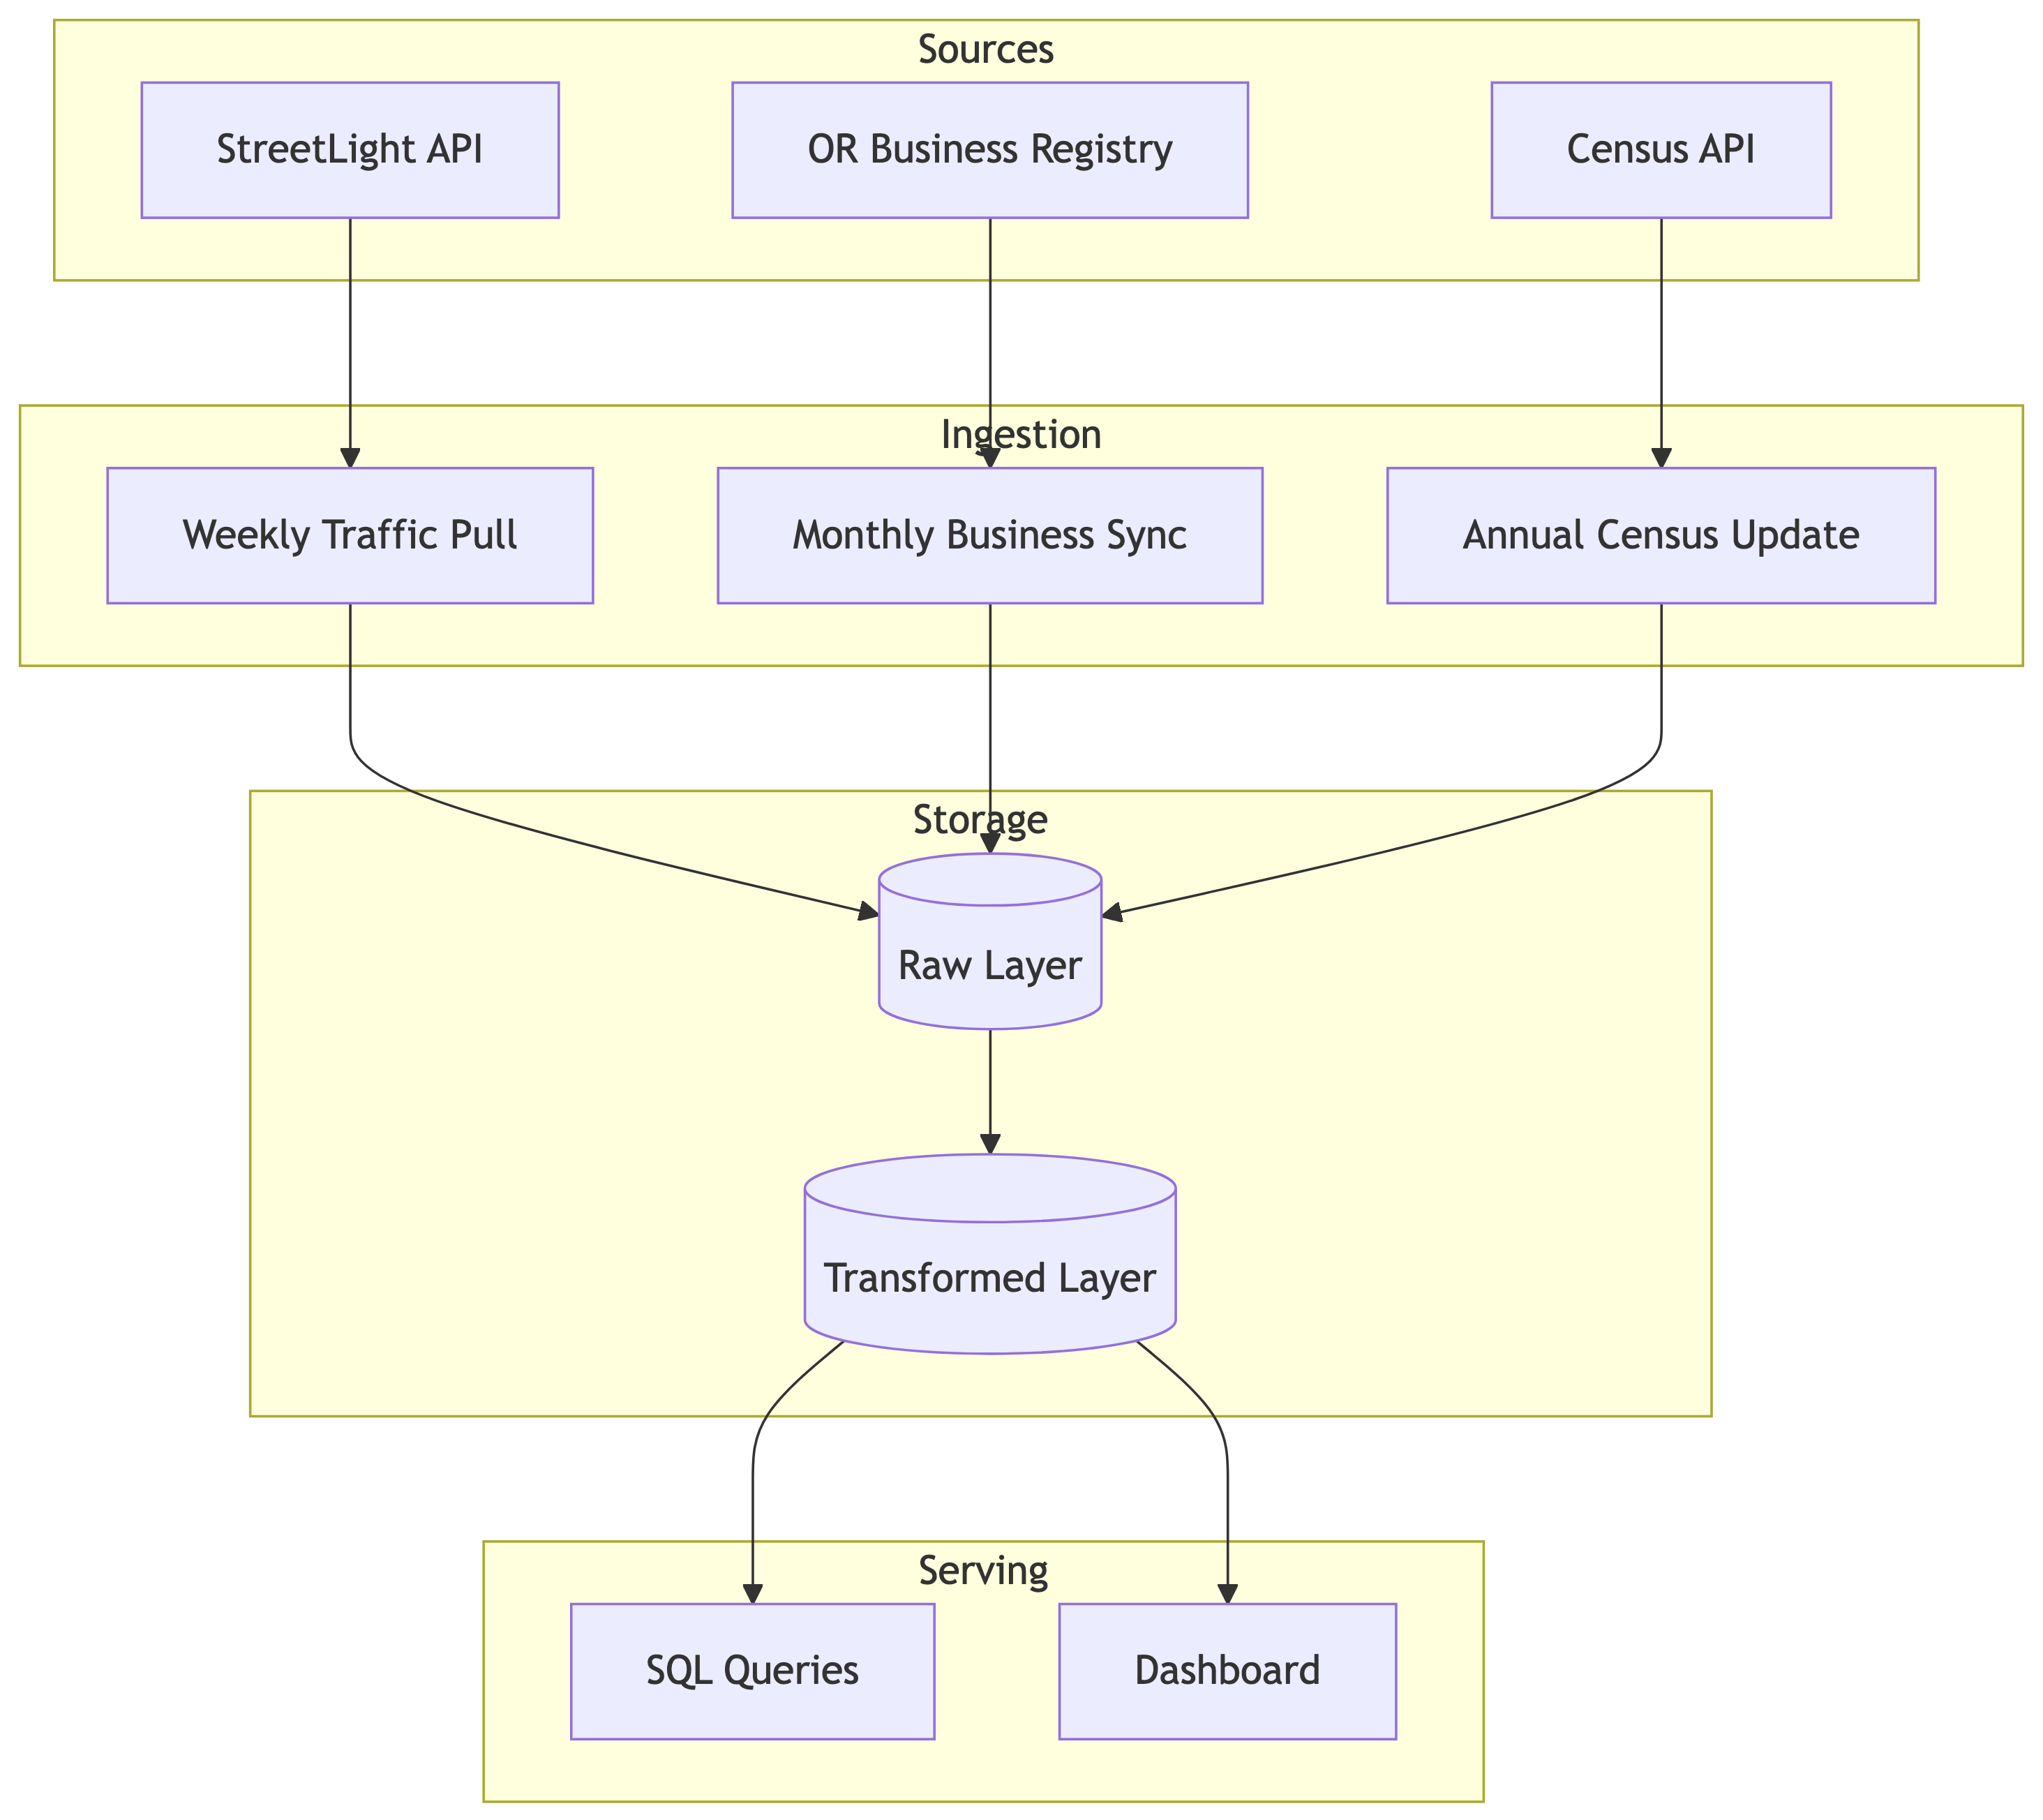
Pipeline Architecture
Feasibility Checklist
| Criterion | Status |
|---|---|
| Data publicly accessible or API available | Yes |
| Rate limits manageable | StreetLight: 1000/day, Census: 500/day |
| Schema stable | Business registry format unchanged since 2019 |
| Can automate ingestion | All sources support scripted pulls |
| Fits 3NF model | Yes, clear entity relationships |
| Answers novel question | No existing dataset combines these three |
What Makes This a Good Project
- Multiple disparate sources - Three distinct data providers
- Non-obvious combination - Traffic + business + demographics is novel
- Clear stakeholder - Chamber of commerce, economic development offices
- Actionable insight - Specific towns get specific recommendations
- Feasible scope - Focus on 20-30 towns, not entire state
- Technical depth - API ingestion, geocoding, time series joins
Finding Your Project Question
The Project Story Template
Write one sentence:
I am investigating [question] by combining [data source 1] and [data source 2] so that [stakeholder] can [decision].
Example:
I am investigating which Portland neighborhoods have the highest gap between Airbnb density and affordable housing availability by combining Inside Airbnb listings and HUD fair market rent data so that housing advocates can target policy interventions.
Good Questions Have These Properties
| Property | Weak Example | Strong Example |
|---|---|---|
| Specific | “How is climate change affecting Oregon?” | “Which Oregon counties show the largest gap between summer fire risk and emergency response capacity?” |
| Multi-source | “What do Yelp reviews say about restaurants?” | “Do Yelp ratings correlate with health inspection scores, and does this vary by neighborhood income?” |
| Actionable | “What is the history of bike lanes?” | “Which Portland intersections have the highest cyclist injury rate per commuter volume?” |
| Feasible | “Predict stock prices” | “Which SEC filing patterns correlate with earnings surprises for Oregon-based public companies?” |
Data Source Categories to Consider
APIs with academic/free tiers:
- Census Bureau, BLS, BEA (economic data)
- OpenWeatherMap, NOAA (weather/climate)
- Spotify, Last.fm (music/entertainment)
- GitHub, Stack Overflow (developer activity)
- Reddit, Twitter/X (social discourse)
Public data portals:
- data.oregon.gov, data.seattle.gov (government)
- Kaggle, UCI ML Repository (curated datasets)
- Inside Airbnb, Open Food Facts (domain-specific)
Scrapeable sources (with care):
- News archives, job boards, event listings
- Real estate listings, product catalogs
Quick Write: Draft Your Question
Take 3 minutes. Write:
- One research question (be specific)
- Two data sources you would combine
- One stakeholder who would use this
You will refine this in the matchmaking activity.
Project Matchmaking Workshop
Workshop Goals
By the end of this hour, you will have:
- Pitched your project idea to 6 different classmates
- Heard 6 different project ideas
- Identified your top 2-3 potential teammates
- Refined your research question based on feedback
Teams of 2-3 will form based on mutual interest and complementary skills.
Workshop Timeline (~50 minutes)
| Phase | Duration | Activity |
|---|---|---|
| 1 | 5 min | Prepare your pitch card |
| 2 | 36 min | Speed rounds (6 rounds x 6 min) |
| 3 | 10 min | Reflection and ranking |
Phase 1: Prepare Your Pitch Card (5 minutes)
Fill out the index card provided with:
Front of card:
- Your name
- Your research question (one sentence)
- Data Source 1 and access method
- Data Source 2 and access method
Back of card:
- One skill you bring (SQL, Python, APIs, visualization, domain knowledge)
- One thing you want to learn
- Your biggest feasibility concern
Phase 2: Speed Rounds Setup
Room setup: Two concentric circles facing each other
- Inner circle: 12 students (stay seated)
- Outer circle: 12 students (rotate clockwise each round)
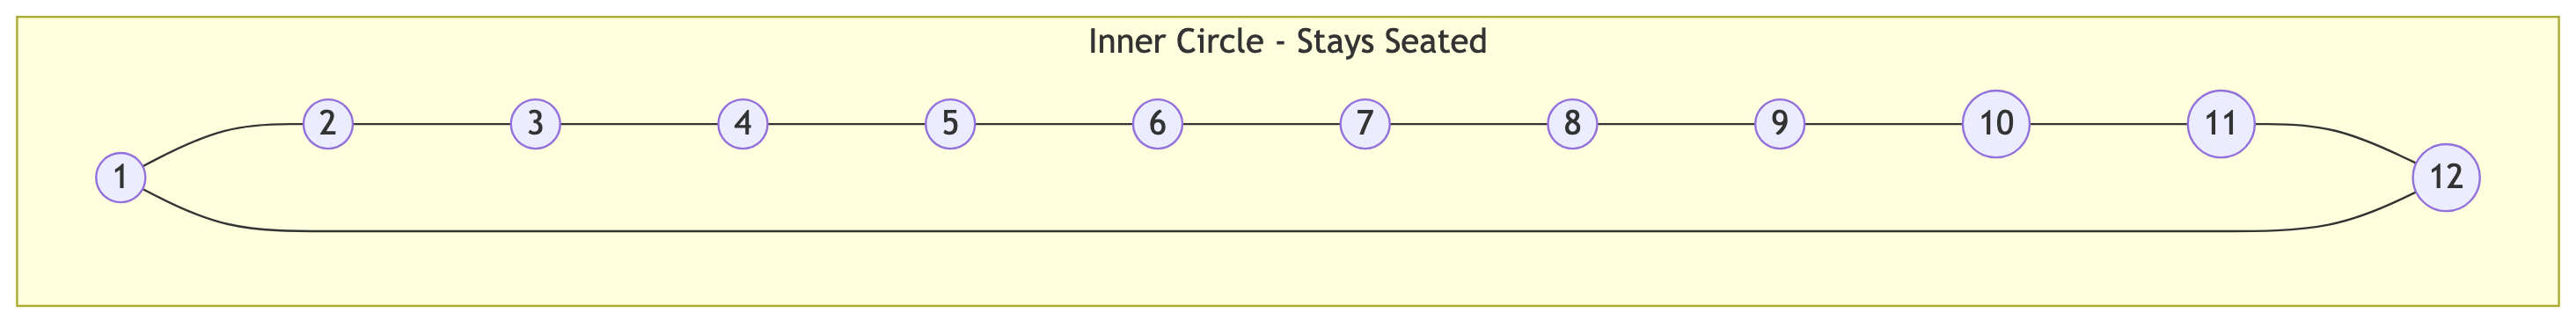
Outer circle faces inner circle and rotates clockwise after each round.
Phase 2: Round Timing (6 min each)
| Time | Activity |
|---|---|
| 0:00-2:00 | Inner circle person pitches |
| 2:00-2:30 | Outer circle asks one question |
| 2:30-4:30 | Outer circle person pitches |
| 4:30-5:00 | Inner circle asks one question |
| 5:00-6:00 | Both score and take notes, outer rotates |
You will complete 6 rounds total.
Your Pitch Script (2 minutes)
Cover these points in order:
- Question (15 sec): “I want to investigate…”
- Sources (30 sec): “I would combine X from [source] with Y from [source]…”
- Why it matters (30 sec): “This matters because [stakeholder] currently cannot…”
- Pipeline vision (30 sec): “The pipeline would ingest…, transform by…, and serve…”
- What I bring (15 sec): “I can contribute… and want to learn…”
Feasibility Questions to Ask
Use your 30-second question slot wisely. Good questions:
- “What is the API rate limit for your main source?”
- “How would you handle missing data in the join?”
- “What granularity does your data have: daily, weekly, per-record?”
- “Have you confirmed the data is actually accessible?”
- “What would the minimal viable dataset look like?”
- “How would you normalize this into 3NF?”
Scoring Your Matches
After each round, record on your score sheet:
| Field | Description |
|---|---|
| Partner name | Who you talked to |
| Their question | Brief summary |
| Fit score (1-3) | 3 = strong overlap, 2 = complementary, 1 = not a fit |
| Notes | Skills, concerns, ideas that emerged |
Score 3 if:
- Your questions could combine into one richer project
- Your skills complement each other
- You are excited about their approach
Phase 3: Reflection and Ranking (10 minutes)
After all 6 rounds, take 10 minutes to:
- Review your scores - Who were your 3s?
- Refine your question - What did you learn from feedback?
- Rank your top 3 - Who would you most want to work with?
- Write a revised pitch - One sentence, improved
Fill out the team preference form:
- First choice partner (and why)
- Second choice partner (and why)
- Third choice partner (and why)
- Revised research question
Phase 4: Team Formation (9 minutes)
Process:
- Submit preference forms to instructor
- Instructor identifies mutual first-choices (these form teams immediately)
- Remaining students matched based on second/third preferences and skill balance
- Teams announced before end of class
Teams of 3: Some teams will have 3 members based on mutual rankings and project scope.
Project Success Criteria
Your project will be evaluated on:
| Criterion | What We Look For |
|---|---|
| Research question | Specific, answerable, novel |
| Data sources | Multiple, disparate, properly cited |
| Pipeline design | Ingestion, transformation, serving layers clear |
| Schema | Normalized (3NF preferred), documented |
| Implementation | Working code, reproducible |
| Story | Clear narrative connecting data to insight to action |
Key Takeaways
What We Covered
- Data stories have three parts: question, evidence, action
- Pipelines enable stories by combining sources that don’t talk to each other
- Good projects are specific, multi-source, actionable, and feasible
- Team formation works best with diverse skills and shared vision
Your Exit Ticket
Before you leave, submit:
- Your team preference form
- Your revised research question (one sentence)
- One feasibility concern you need to resolve this week