Lecture 09-0: Web API Pipelines with Railway
DATA 503: Fundamentals of Data Engineering
March 11, 2026
Why Web API Pipelines?
The Group Project Problem
Your group project requires two things that are hard to do on a laptop:
- A shared database that every team member can access
- Automated data collection that runs on a schedule, even when your laptop is closed
Today we solve both of those problems.
When Do You Need a Polling Service?
A web API polling service is for continuous, periodic data collection. Think:
- Weather readings every 5 minutes
- Flight positions updated in real time
- Sensor data from IoT devices
- Stock prices throughout the trading day
You do not need a polling service for downloading a static CSV or a one-time data dump. Just download the file. The exception is when an API has strict rate limits and you need to spread requests over time.
What We Are Building Today
By the end of today, you will have two services running in the cloud, collecting weather and flight data over Portland every five minutes, storing it all in a shared Postgres database.
Introducing Railway
What is Railway?
Railway is a Platform-as-a-Service (PaaS). Think of it as a friendly version of AWS. You tell it what to run, and it handles servers, networking, deployment, and scaling.
You sign up with your GitHub account (recommended) at railway.app.
Free Trial vs Hobby Plan
This matters, so pay attention:
| Free Trial | Hobby Plan | |
|---|---|---|
| Cost | Free ($5 credit) | $5/month (with $5 credit) |
| Net cost | Free until credit runs out | Effectively free for small projects |
| Cron jobs | Not available | Available |
| Always-on services | Limited execution time | Yes |
| Expiration | Credit expires | Ongoing |
The Hobby plan is required for cron jobs. Since it gives you a $5 credit against the $5 charge, small projects like ours cost nothing. Sign up for Hobby.
Sharing a Workspace with Your Team
Railway uses Teams for collaboration:
- Go to Settings > Teams > Create Team
- Add members by their Railway username or email
- Team members can see all projects and services in the team workspace
Each team member needs their own Railway account (Hobby plan recommended). One person creates the team, everyone else joins. This is how your project groups will collaborate on a shared database and shared services.
Creating a Project
- Click New Project from the Railway dashboard
- Give it a meaningful name (e.g., “DATA 503 - Team Weather”)
- Railway creates a default environment called
production; you can rename it if you want
This project is the container for everything we build today: the database and the ingestion services.
Setting Up PostgreSQL on Railway
Adding a Postgres Service
Inside your project:
- Click New (the purple button)
- Select Database > PostgreSQL
- Railway provisions a Postgres instance in about 10 seconds
That is it. You now have a cloud database.
Understanding the Connection Variables
Click on your Postgres service and open the Variables tab. You will see a wall of variables. Here are the ones that matter:
| Variable | What It Is | Where You Use It |
|---|---|---|
DATABASE_URL |
Internal connection URL | Used by other Railway services in the same project (fast, no internet routing) |
DATABASE_PUBLIC_URL |
Public connection URL | Used by external tools like Beekeeper Studio and pgAdmin (goes over the internet) |
PGHOST, PGPORT, PGUSER, PGPASSWORD, PGDATABASE |
Individual connection components | Alternative to the URL, useful when a tool needs separate fields |
Internal vs Public URLs
The internal DATABASE_URL is only accessible from within Railway’s network. Other services in the same project reference it as ${{Postgres.DATABASE_URL}} and it resolves automatically. This is fast because traffic never leaves Railway’s infrastructure.
The DATABASE_PUBLIC_URL is accessible from anywhere on the internet. This is what you paste into Beekeeper or pgAdmin on your laptop. It routes through Railway’s proxy, so it is slightly slower, but it works from anywhere.
Connecting with Beekeeper Studio and pgAdmin
Beekeeper Studio
- Open Beekeeper Studio
- Click New Connection > PostgreSQL
- Click “Import from URL”
- Paste the
DATABASE_PUBLIC_URLfrom Railway - Click Connect
That is genuinely all there is to it. Beekeeper parses the URL and fills in everything for you.
pgAdmin
pgAdmin requires you to fill in the fields manually:
Open pgAdmin
Right-click Servers > Register > Server
General tab: give it a name like “Railway - Project Name”
Connection tab: fill in the individual fields from Railway’s variables:
- Host: the
PGHOSTvalue (e.g.,roundhouse.proxy.rlwy.net) - Port: the
PGPORTvalue (e.g.,20848) - Maintenance database:
railway - Username:
postgres - Password: the
PGPASSWORDvalue
- Host: the
Click Save
Verify Your Connection
Run a simple query to confirm everything works:
If you get a result, you are connected.
Warning
Pay attention to which database you are connected to. If you have multiple databases (local, Railway, class server), it is easy to run queries against the wrong one. Check the connection indicator in your tool before executing anything destructive.
Understanding Web APIs
What is a Web API?
A web API is a structured way to request data from a server using URLs.
- The URL is the request
- The JSON is the response
That is the mental model. You construct a URL with the right parameters, send it to a server, and get back structured data.
The Golden Rule
To use any API, you need to read its documentation.
Understand three things:
- The base URL (where the API lives)
- The available endpoints (what data you can request)
- The query parameters (how you customize the request)
Let us look at two APIs we will use today.
Open-Meteo Weather API
Docs: open-meteo.com/en/docs
No API key required. Free and open.
Base URL: https://api.open-meteo.com/v1/forecast
Parameters for Portland weather:
| Parameter | Value | Purpose |
|---|---|---|
latitude |
45.52 |
Portland, OR |
longitude |
-122.68 |
Portland, OR |
current |
temperature_2m,wind_speed_10m,weathercode |
Current conditions we want |
The Weather API URL
The full URL:
https://api.open-meteo.com/v1/forecast?latitude=45.52&longitude=-122.68¤t=temperature_2m,wind_speed_10m,weathercodeYou can paste this directly into your browser to see the response. Try it.
Weather API Response
The response looks something like this:
{
  "latitude": 45.52,
  "longitude": -122.68,
  "current_units": {
    "time": "iso8601",
    "interval": "seconds",
    "temperature_2m": "°C",
    "wind_speed_10m": "km/h",
    "weathercode": "wmo code"
  },
  "current": {
    "time": "2026-03-09T14:30",
    "interval": 900,
    "temperature_2m": 8.2,
    "wind_speed_10m": 12.5,
    "weathercode": 3
  }
}
The current object has everything we care about: temperature in Celsius, wind speed in km/h, and a WMO weather code (0 = clear, 3 = overcast, 61 = rain, etc.).
OpenSky Network Flight API
Docs: openskynetwork.github.io/opensky-api
No API key required for anonymous access (but rate limited to ~10 requests per minute).
Base URL: https://opensky-network.org/api/states/all
Parameters for the Portland metro bounding box:
| Parameter | Value | Purpose |
|---|---|---|
lamin |
45.2 |
Southern boundary latitude |
lomin |
-123.2 |
Western boundary longitude |
lamax |
45.8 |
Northern boundary latitude |
lomax |
-122.2 |
Eastern boundary longitude |
The Flight API URL
The full URL:
https://opensky-network.org/api/states/all?lamin=45.2&lomin=-123.2&lamax=45.8&lomax=-122.2Flight API Response
The response has a time field and a states array:
Each inner array is one aircraft. The key indices:
[0]= ICAO24 transponder address[1]= callsign[2]= origin country[5]= longitude[6]= latitude[7]= altitude (meters)
Note: states can be null when no aircraft are in the bounding box. That is normal, especially late at night.
The api2db Template
What is api2db?
lucascordova/api2db is a Docker container that does one simple thing:
- Fetches a URL
- Stores the JSON response in a Postgres table
It runs once per execution and exits. Combined with Railway’s cron scheduling, it becomes an automated data collection pipeline.
The table it creates has this structure:
Every row is one API response: the raw JSON and when it was collected.
Deploying via Template
Use this template link to deploy:
railway.com/deploy/api2db-template
Steps:
- Click the template link
- Click “Deploy Now”
- Select your project and environment
- Configure the environment variables (next slide)
Environment Variables
| Variable | Required? | Default | Purpose |
|---|---|---|---|
SITE_URL |
Yes | (none) | The API URL to fetch |
TABLE_NAME |
Yes | (none) | The Postgres table name to store data in (created automatically if it does not exist) |
DATABASE_URL |
Preconfigured | ${{Postgres.DATABASE_URL}} |
Internal connection to your Railway Postgres. Uses Railway’s variable referencing so it auto-connects. |
DEBUG |
Preconfigured | false |
Set to true for verbose logging |
HEADER_KEYS |
Preconfigured | {} |
HTTP headers to send with the request (JSON object) |
What Are Header Keys?
Some APIs require authentication or special headers with each request. HEADER_KEYS is a JSON object of key-value pairs that get sent as HTTP headers.
Examples:
- Bearer token:
{"Authorization": "Bearer abc123xyz"} - API key header:
{"X-API-Key": "your-key-here"}
Our APIs (Open-Meteo and OpenSky) do not require any headers, so {} is fine. But if your group project API requires authentication, this is where those credentials go.
What is Cron?
Cron Expressions
Cron is a time-based job scheduler. Railway uses cron expressions to determine when a service runs.
The format is five fields:
┌───────────── minute (0-59)
│ ┌───────────── hour (0-23)
│ │ ┌───────────── day of month (1-31)
│ │ │ ┌───────────── month (1-12)
│ │ │ │ ┌───────────── day of week (0-6, Sunday=0)
│ │ │ │ │
* * * * *
Common Cron Examples
| Expression | Meaning |
|---|---|
*/5 * * * * |
Every 5 minutes |
0 * * * * |
Every hour on the hour |
0 9 * * 1 |
Every Monday at 9 AM |
0 0 * * * |
Midnight every day |
Use crontab.guru to test and visualize cron expressions. It is a lifesaver.
We will use */5 * * * * (every 5 minutes) for both of our services.
Creating the Staging Tables
The Staging Tables
Both staging tables have the same dead-simple structure:
One column for the ID, one for the entire JSON blob, one for when we grabbed it.
This is the database equivalent of throwing everything in a cardboard box during a move. It works, but you would not want to live like that.
Deploying the Weather Service
Step by Step
Open the api2db template link
Select your project and environment
Set the environment variables:
SITE_URL=https://api.open-meteo.com/v1/forecast?latitude=45.52&longitude=-122.68¤t=temperature_2m,wind_speed_10m,weathercodeTABLE_NAME=weather_json_data
Click Deploy
Once deployed, go to Settings
Under Cron Schedule, enter:
*/5 * * * *Rename the service to
weather-ingestion
The service will now run every 5 minutes, fetch the current Portland weather, and store it in the weather_json_data table.
Deploying the Flight Service
Same Process, Different Data
Open the api2db template link again
Select your project and environment
Set the environment variables:
SITE_URL=https://opensky-network.org/api/states/all?lamin=45.2&lomin=-123.2&lamax=45.8&lomax=-122.2TABLE_NAME=flight_json_data
Click Deploy
Set Cron Schedule to:
*/5 * * * *Rename the service to
flight-ingestion
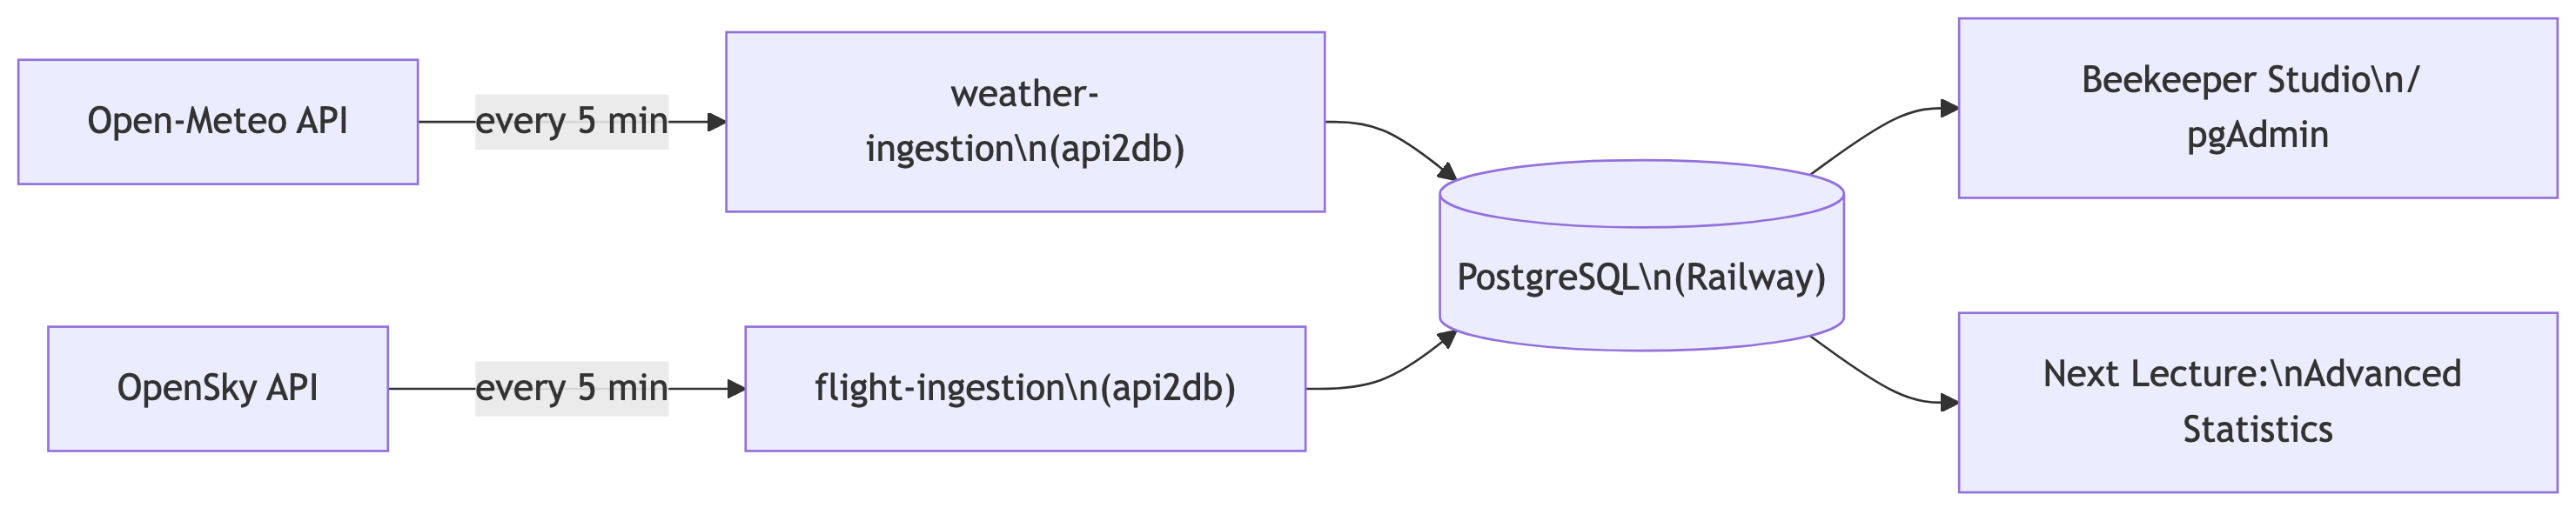
Your Railway Project
Your project should now look something like this:
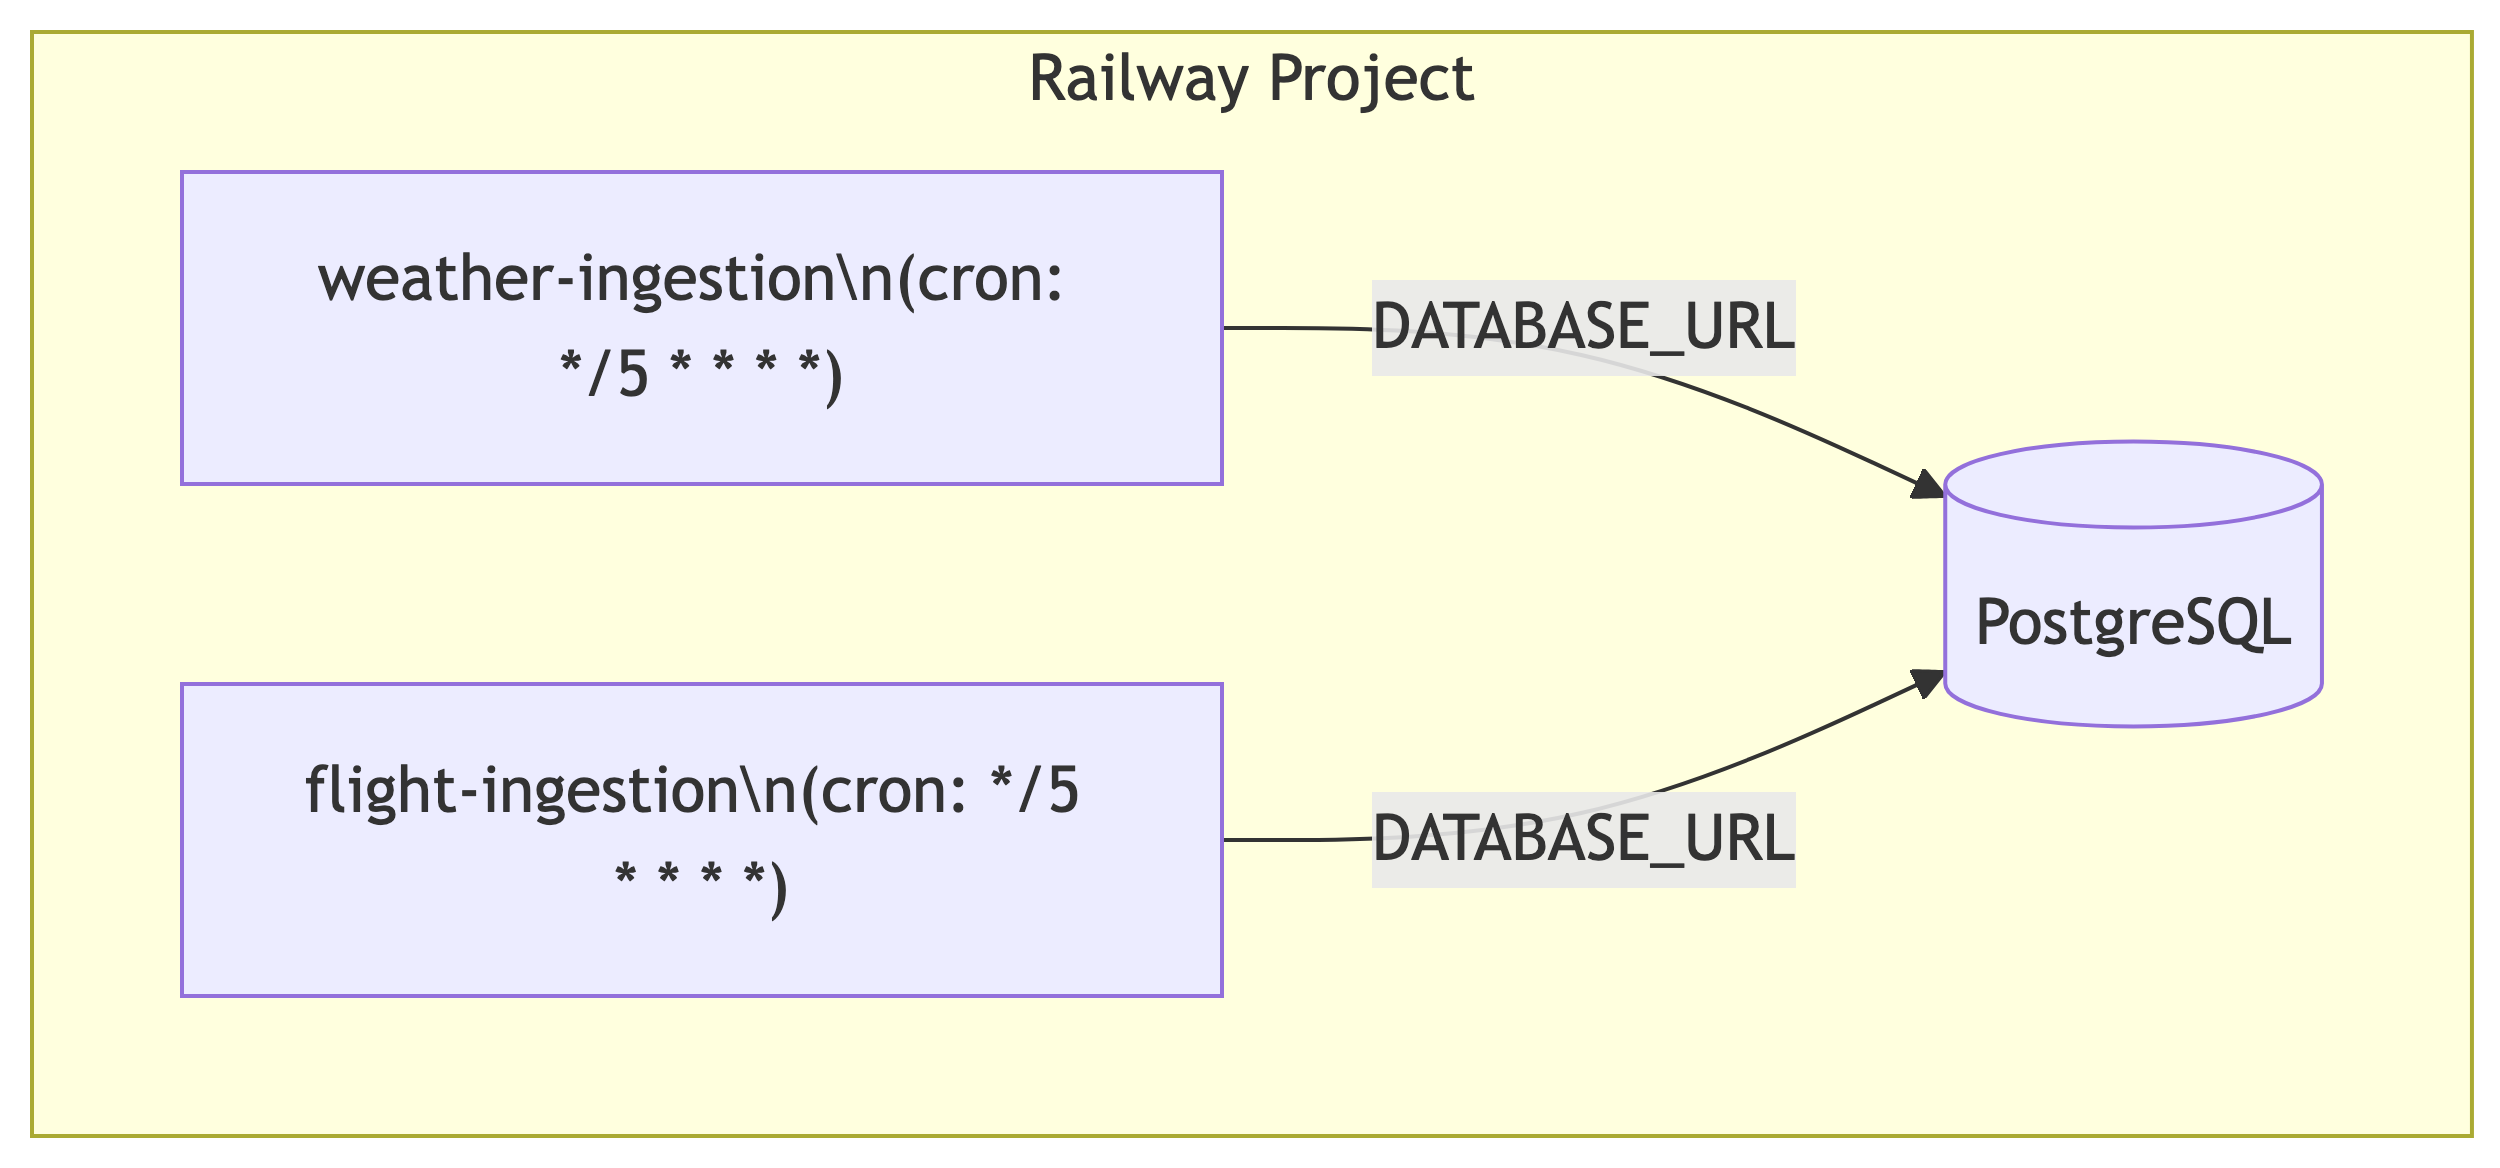
Three services: one database, two ingestion workers. Clean and simple.
Verifying Data Collection
Wait for the First Run
Cron services run on schedule, not immediately on deploy. Wait about 5 minutes for the first trigger, or check the Deployments tab to see if a run has completed.
Check Row Counts
Connect to your database via Beekeeper Studio and run:
If you see numbers greater than zero, your pipeline is working.
Peek at Weather Data
Peek at Flight Data
The WHERE clause filters out rows where no aircraft were in the bounding box (the states field is null).
Troubleshooting
If you are not seeing data:
- Check the Deployments tab: is the service actually running? Look for successful completions.
- Check the Logs tab: error messages will tell you what went wrong.
- Verify
SITE_URL: a single typo in the URL will cause failures. Copy-paste, do not retype. - Check
DATABASE_URL: it should be${{Postgres.DATABASE_URL}}(with the double curly braces). If you typed a raw connection string, it will not resolve inside Railway.
What Comes Next
Let the Data Accumulate
Your services are now collecting data every 5 minutes. Let them run.
For meaningful analysis, you want at least a week of data, ideally two weeks. That gives us:
- ~2,000 weather readings
- ~2,000 flight snapshots
- Enough variation to see patterns across weekdays, weekends, day, and night
The Full Pipeline
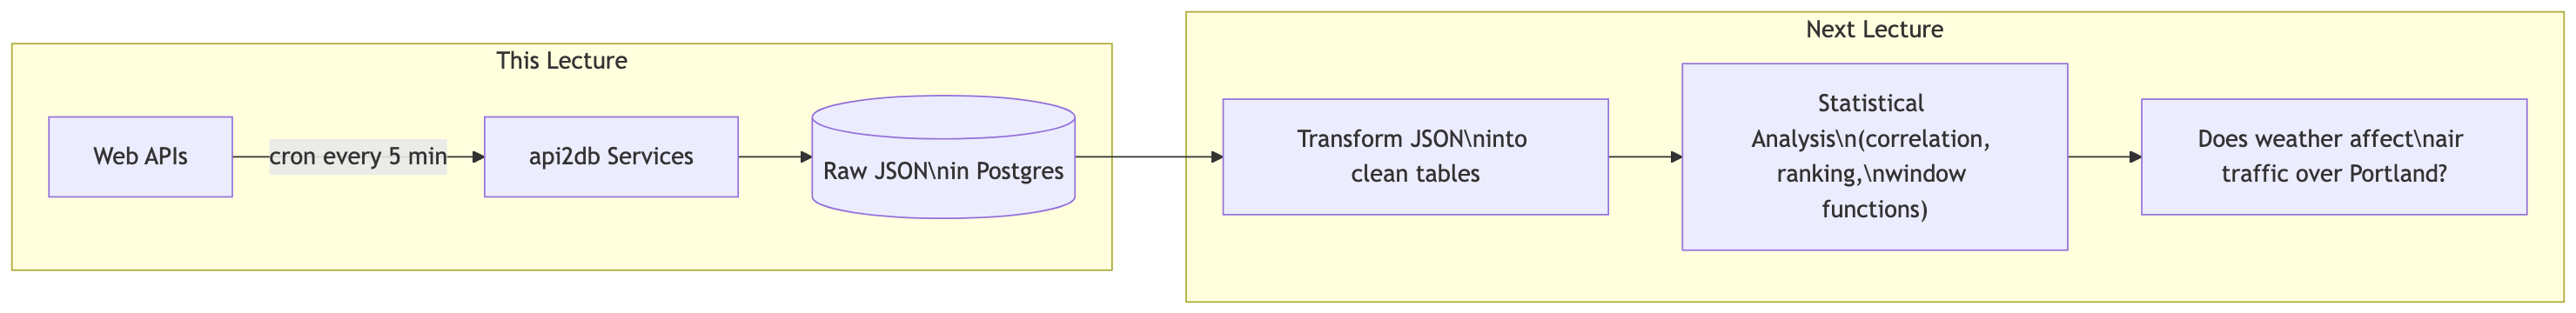
Next Lecture: Advanced Statistics
In the next lecture, we will:
- Transform the raw JSON into clean, normalized tables
- Run statistical analysis: correlation, ranking, window functions
- Answer a real question: does weather affect air traffic over Portland?
The data you are collecting right now is what makes that analysis possible. Do not turn off your services.